Case Study - Copenhagen's Cloudburst Plan
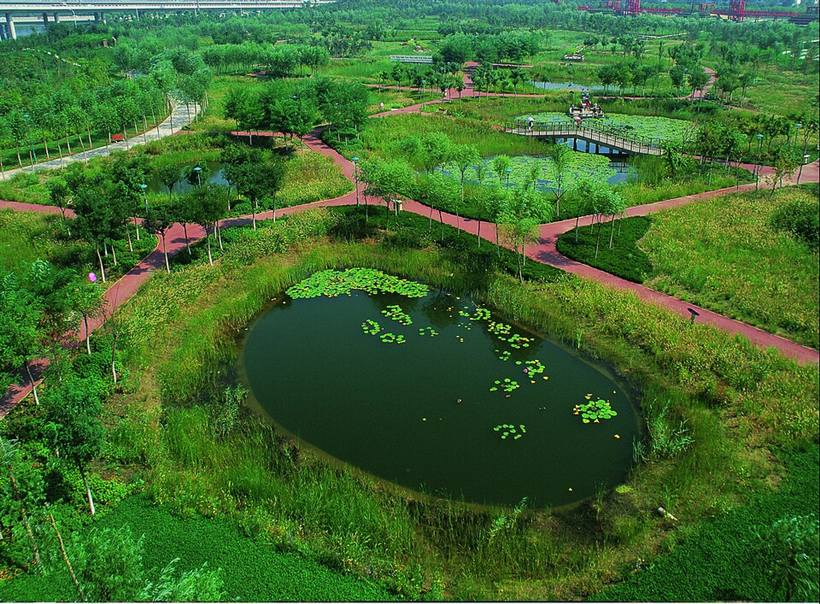
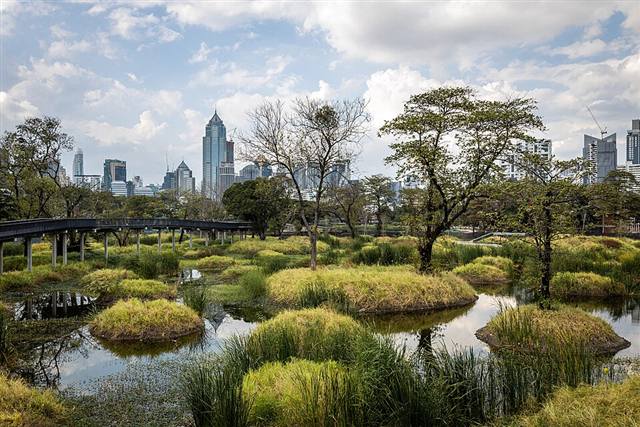
A cloudburst on July 2, 2011 caused more than DKK 6 billion of damage in Copenhagen. The city's Cloudburst Management Plan, drawn up in 2012, has about 300 surface projects, such as green streets, parks and squares that hold water, retention basins and channels to the harbour, with about 15 built each year over at least 20 years. It aims to protect against a 100-year rain.
The city compared two options. Larger sewers alone were estimated at DKK 20 billion; the chosen mix of surface works and some pipes at about DKK 11 billion in 2015 prices. Both would avoid about DKK 16 billion of flood damage over 100 years, so the conventional option shows a net loss of DKK 4 billion and the combined option a net gain of DKK 3 billion. Building on the surface cost about half as much and added green space.
Chart - Two Ways To Stop A Cloudburst
Source: Climate-ADAPT
A Park That Holds A Flood
India Desk - Chennai's Lost Sponge
Chennai shows what happens when a city's natural sponge is built over. Its water-body area shrank from 12.6 sq km in 1893 to 3.2 sq km in 2017. In the December 2015 floods, 490 mm fell at Tambaram in 24 hours and Tamil Nadu reported 421 deaths; the Comptroller and Auditor General later called the flooding a "man-made disaster", with building over wetlands named as a cause. In 2012 the city corporation began building 5,000 rainwater harvesting structures in its stormwater drains.
2015 South India floods (reference) - Water management in Chennai (reference)
The Sponge City In Numbers
Source: Griffiths et al., 2020
Reading List
Griffiths et al., "Interpretation and application of Sponge City guidelines in China" (2020). Targets, costs and the pilot record.
Climate-ADAPT: Copenhagen's Cloudburst Plan. The cost-benefit case in full.
For Discussion
1. Where does rain go after it lands on your street? Trace it to the nearest drain, river or lake. 2. Should a sponge city be judged by floods prevented, by health gains, or by green space created?